PAA Health Status
Users can effectively monitor the health status of their PAAs and obtain detailed information about the Agent services.
To access the PAA cards and monitor the health status of the PAA group:
-
Navigate to either Environment Settings or Tenant Settings > Policy Authorization Agents.
-
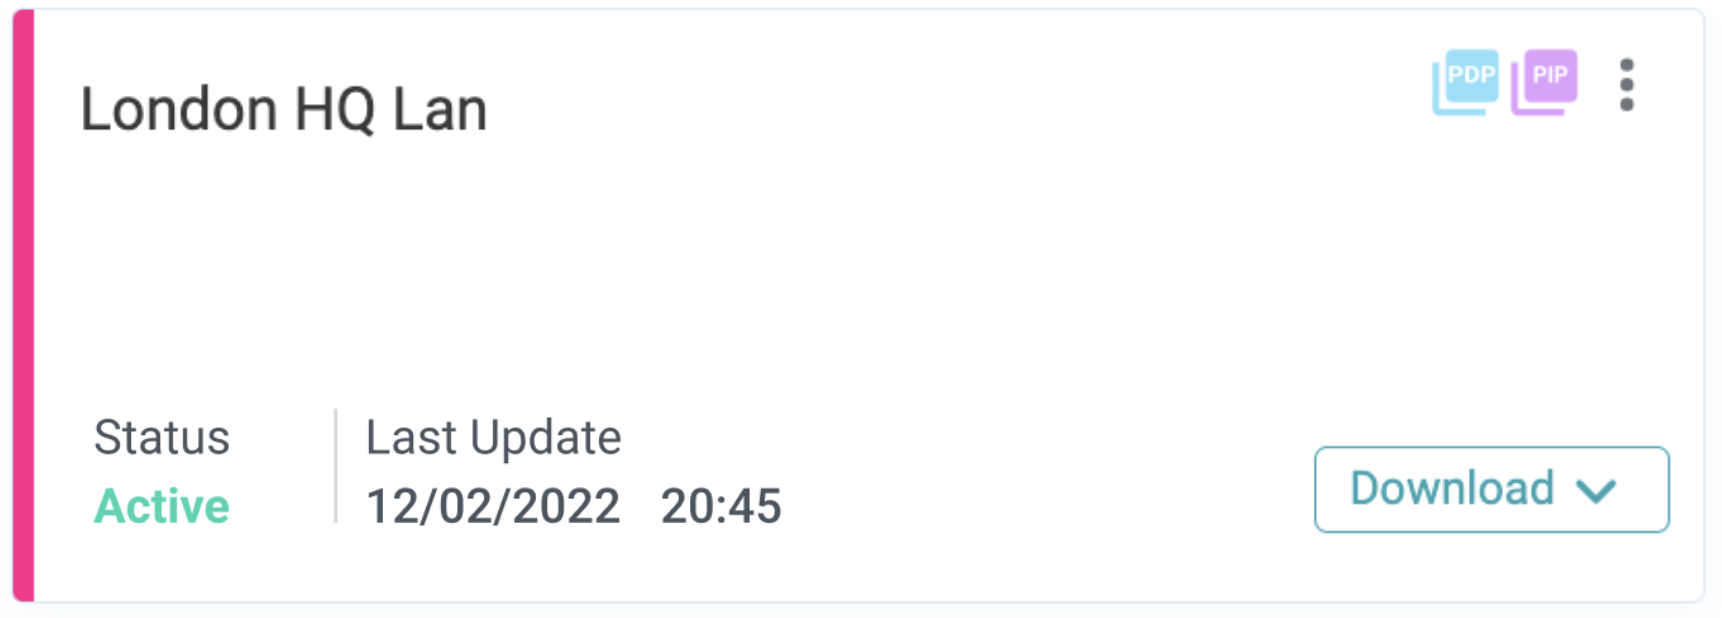
You can see a list of PAA cards representing each individual PAA. Each card provides information about the PAA's health status and the time of the last update.
-
If a PAA is created, but has not yet been deployed, the PAA status displays N/A, and the last update field displays Not Connected. This indicates that the PAA has not established a connection or received any updates yet.
-
The PAA status reflects the status of the mandatory Agent services and does not include information about optional services.
-

To access detailed information about the health of a specific PAA group:
-
Select a PAA.
-
On the right side of the screen, a panel displays information and statuses regarding the Agent services for that PAA.
-
Hover over the status symbols for more information about the Agent service status.
Refer to the legend below for more information on the Agent service status symbols:
| Symbol | Description |
|---|---|
 |
- The service is running. - The service is using the latest version. - No critical errors are identified. |
 |
- The service is not using the latest version. - The PIP Operator is not configured.* - The PIP Operator deployment settings are not synced with the PIP deployment settings in the cloud. - The Redis keys are out of sync |
 |
- A running service reports an error. |
 |
- A required service is not running. - The status of the service has not been received for a duration of five cycles. |
 |
- An optional service is not running (see below). Optional services include IDP Webhooks and Secret Management. These services are not mandatory for the PAA to function, but their status is still monitored. |
*See Guidelines for PIP Settings in Managing Views for more information.
Service Health Indication
When the PlainID Agent detects an issue with a service, it reports it up to the Tenant, and is reflected in the PAA status card. In addition, the Agent stores a log record indicating the reported service issue locally in the Agent log file in the PAA. This approach allows for integration with monitoring systems to trigger alerts when errors occur. Through this reporting mechanism, users ensure effective health monitoring and response to service-related problems.
Example error message:
{
  "timestamp": "2023-06-26T13:35:40.332+0000",
  "app": {
    "level": "ERROR",
    "service": "agent",
    "caller": "com.plainid.warp.health.HealthControllerAndCollector",
    "method": "reportToLogIfError",
    "line": "77",
    "thread": "scheduling-1",
    "rel": 756561,
    "seq": 182
  },

  "message": "HealthStatus: {\"status\":\"error\",\"message\":\"Service runtime is not alive\",\"paaPackageVersion\":\"5.2326.14\",\"kubernetesHealthStatus\":{\"status\":\"unavailable\"},\"registryHealthStatus\":[{\"service\":\"agent\",\"version\":\"5.2326.16/1.0.0/d85fcd4\",\"livenessObject\":{\"status\":\"UP\",\"components\":{\"connectedToRemoteWarp\":{\"status\":\"UP\"},\"diskSpace\":{\"status\":\"UP\",\"details\":{\"total\":107361579008,\"free\":77880508416,\"threshold\":10485760,\"path\":\"/app/.\",\"exists\":true}},\"livenessState\":{\"status\":\"UP\"},\"piggiesStatus\":{\"status\":\"UP\"},\"ping\":{\"status\":\"UP\"},\"readinessState\":{\"status\":\"UP\"},\"redis\":{\"status\":\"UP\",\"details\":{\"version\":\"7.0.11\"}}},\"prometheus\":\"# HELP plainid_test_total  \\n# TYPE plainid_test_total counter\\nplainid_test_total 2167.0\\n\"},\"alive\":true},{\"service\":\"pip-operator\",\"version\":\"5.2326.6/1.1.0/dd24a09\",\"livenessObject\":{\"status\":\"UP\",\"components\":{\"checksumStatus\":{\"status\":\"UP\",\"details\":{\"checksum\":\"6aa94582966ccb2863c97878726bb27a81d1268ee88440109c98d6198d1d9824\"}},\"diskSpace\":{\"status\":\"UP\",\"details\":{\"total\":107352141824,\"free\":82427686912,\"threshold\":10485760,\"path\":\"/app/.\",\"exists\":true}},\"livenessState\":{\"status\":\"UP\"},\"ping\":{\"status\":\"UP\"},\"readinessState\":{\"status\":\"UP\"},\"redis\":{\"status\":\"UP\",\"details\":{\"version\":\"7.0.11\"}}},\"prometheus\":\"\"},\"alive\":true},{\"service\":\"redisync\",\"version\":\"1.0.0\",\"livenessObject\":{\"status\":\"UP\",\"components\":{\"diskSpace\":{\"status\":\"UP\",\"details\":{\"total\":107361579008,\"free\":77880508416,\"threshold\":10485760,\"path\":\"/app/.\",\"exists\":true}},\"healthExtension\":{\"status\":\"UP\"},\"livenessState\":{\"status\":\"UP\"},\"ping\":{\"status\":\"UP\"},\"readinessState\":{\"status\":\"UP\"},\"redis\":{\"status\":\"UP\",\"details\":{\"version\":\"7.0.11\"}}},\"prometheus\":\"\"},\"alive\":true},{\"service\":\"runtime\",\"version\":\"5.2326.3\",\"livenessObject\":{\"status\":\"DOWN\",\"components\":{\"livenessState\":{\"status\":\"DOWN\",\"details\":\"I/O error on GET request for \\\"http://plainid-paa-runtime/api/runtime_health_check\\\": Connect timed out\"}}},\"alive\":false}]}"

}
PAA Health Checks
PlainID provides APIs for customers to check the micro-service health status based on their configuration.
PlainID Agent Service
K8:
http://plainid-paa-agent/actuator/health
Standalone:
http://plainid-agent_address>:<plainid-agent_port>/actuator/health
The Agent Service GET request retrieves the PAA's Agent health status.
Authorization
- None
Body
- None
Standalone Parameters
| Parameter | Value |
|---|---|
| <plainid-agent_address> | Standalone - Server host name |
| <plainid-agent_management_port> | 8081 (Default) |
Service Response:
{
  "status": "UP",
  "components": {
    "connectedToRemoteWarp": {
      "status": "UP"
    },
    "diskSpace": {
      "status": "UP",
      "details": {
        "total": 133003395072,
        "free": 103323860992,
        "threshold": 10485760,
        "path": "/app/.",
        "exists": true
      }
    },
    "livenessState": {
      "status": "UP"
    },
    "piggiesStatus": {
      "status": "UP"
    },
    "ping": {
      "status": "UP"
    },
    "readinessState": {
      "status": "UP"
    },
    "redis": {
      "status": "UP",
      "details": {
        "version": "6.0.14"
      }
    }
  },
  "groups": [
    "liveness",
    "readiness"
  ]
}
Runtime Service
The Runtime Service GET request retrieves the PAA's runtime service health status.
K8:
http://plainid-paa-runtime/api/runtime_health_check
Standalone:
http://<runtime_address>:<runtime_management_port>/api/runtime_health_check
Authorization
- None
Header
- None
Standalone Parameters
| Parameter | Value |
|---|---|
| <runtime_address> | Standalone - Server host name |
| <runtime_management_port> | 8010 (Standalone Service - default internal runtime port) |
Service Response:
{
  "status": "UP",
  "details": {
    "redis": {
      "status": "UP",
      "details": {
        "read": {
          "status": "UP"
        },
        "write": {
          "status": "UP"
        }
      }
    }
  }
}
PIP Operator Service
The PIP Operator Service GET request retrieves the PAA's PIP Operator health status.
K8:
http://plainid-paa-pip-operator/actuator/health
Standalone:
http://<pip-operator_address>:<pip-operator_management_port>/actuator/health
Authorization
- None
Header
- None
Standalone Parameters
| Parameter | Value |
|---|---|
| <pip-operator_address> | Standalone - Server host name |
| <pip-operator_management_port> | 8089 (Default) |
Service Response:
{
  "status": "UP",
  "components": {
    "diskSpace": {
      "status": "UP",
      "details": {
        "total": 101203873792,
        "free": 92163268608,
        "threshold": 10485760,
        "exists": true
      }
    },
    "livenessState": {
      "status": "UP"
    },
    "ping": {
      "status": "UP"
    },
    "readinessState": {
      "status": "UP"
    },
    "vdbSettingsState": {
      "status": "UP"
    }
  },
  "groups": [
    "liveness",
    "readiness"
  ]
}